How to Use the Reliability Tracker

.svg)
.svg)

Introduction
In this tutorial, we'll show you how to use Gremlin's Reliability Tracker. The Reliability Tracker is a framework that helps you find and fix reliability risks before they become disruptive outages. Designed by reliability and Chaos Engineering experts, it lets you map out your services, most likely failure scenarios, and the outcome of reliability testing in the form of an easy-to-read spreadsheet. By combining this spreadsheet with reliability testing, you’ll be able to test your systems, find reliability risks, and know what will happen if they fail—then prioritize your engineering efforts to stop disruptive outages before they happen.
Overview
This tutorial will show you how to:
- Document your services.
- Identify potential failure modes.
- Perform an initial reliability risk assessment to baseline your services.
- Perform additional assessments and track changes in reliability.
Prerequisites
Before starting this tutorial, you’ll need the following:
- A blank spreadsheet (you can also download a copy of the Reliability Tracker template if you don't want to create it from scratch).
- One or more services that you own or maintain.
Note: You don't need a Gremlin account for this tutorial, but if you'd like to sign up for a free 30-day trial, you can do so here.
Step 1 - Document your services
Before we can start tracking reliability, we need something to track. Gremlin uses services, which are sets of functionality provided by one or more systems within your environment. A service performs some specific function in your application, such as authentication, load balancing, data processing, etc. A service could be:
- A Kubernetes Deployment running a Node.js application.
- A Java monolith running business logic.
- A black box service hosted by another team in the organization.
We recommend focusing on services for several reasons:
- Modern development teams tend to work on services rather than monoliths.
- Services are easier to conceptualize, as compared to something more tactical like a process or container.
- Many organizations structure teams around services, with each team being responsible for at least one service. This makes it easier to assign ownership.
We'll start our Reliability Tracker by listing our services. Open a new spreadsheet in your preferred spreadsheet tool. In cell A1, enter "Service". In the column below that, list each service that you want to track. For example:
It's also important to give each service a tier. A tier is your ranking of how important a service is to the business. For example, a Tier 1 is mission critical and can’t go down for any reason, while a Tier 3 can go down without significantly impacting the business. If you're not sure what tier to assign a service, think about it this way: if this service went offline right now, how quickly would you need to get it back up? If the answer is "immediately," it's a tier 1. If it's "when I'm done with my current task," it's probably a tier 3. If it's somewhere in between, it's a tier 2.
In column B, enter "Tier" for the heading and assign each service a tier:
Step 2 - Identify potential failure modes
Next, we need to identify the different ways our services can fail. There are a few things we should keep in mind:
- We won't be able to list every failure mode. There are a lot, and they'll vary depending on the service. At the very least, we can start by listing the most important ones.
- Not all failure modes will apply to every service. For the ones where it doesn't apply, just enter "N/A" in the cell.
- If you want to group failure modes into categories, you can insert a new row above the header row and define your categories there.
For example, we'll start with Gremlin's reliability tests, which include:
- CPU and memory scalability.
- Host and zone redundancy.
- Slow, unavailable, or insecure dependencies.
This leaves us with the following spreadsheet (limited for conciseness):
Step 3 - Perform an initial reliability risk assessment to baseline your services
Now you're ready to baseline your services. This means running an initial set of reliability tests—before doing any reliability work—to see where your services stand. There are many tools you can use to do this, but we, of course, recommend using Gremlin. You can use our suite of pre-built reliability tests, or our ever-growing library of Chaos Engineering experiments, by signing up for a free 30-day trial.
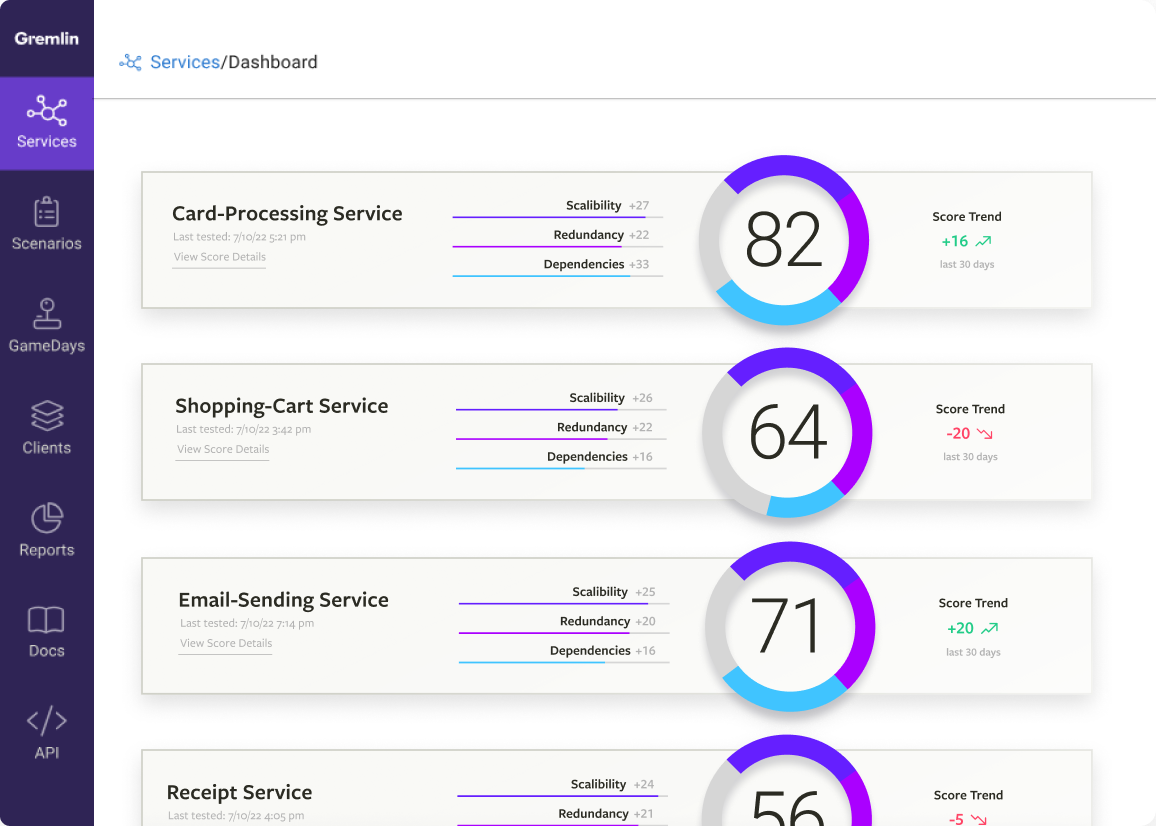
If you do decide to use Gremlin, we recommend setting up your services and running reliability tests. Follow our Gremlin Reliability Management quick start guide to set up Gremlin, add your services, and connect your monitors. The tests used in this tutorial have direct equivalents in Gremlin, so you don't need to worry about setting up tests from scratch. Gremlin also gives each service a reliability score, which will help you in the next step. To run the full set of tests (after adding a service and linking at least one Health Check), just find your service, click on it, then click Run All at the top of the page.
Once each test finishes and you have your results, record them in each cell. We recommend using the following key:
What you'll end up with is a table that looks something like this (with different results, of course):
Optional step - Calculate coverage
Another way to calculate a reliability score is by adding a formula to the spreadsheet. Add a new column to the end of the sheet and name it "Coverage". This column will contain a formula that automatically calculates scores for each service based on their test results. This isn't exactly the same as Gremlin's reliability score, but it does indicate how much testing has been done on each service.
The exact formula will vary depending on how you set up your spreadsheet, but here's an example of the formula for the spreadsheet we just created (note that the downloadable tracker spreadsheet already has this built in):
<span class="code-class-custom"> =IF(COUNTA(C2:F2)=0, "", COUNTIF(C2:F2,"=OK")/COUNTIF(C2:F2,"<>N/A")) </span>
Let's break this down:
- <span class="code-class-custom">=IF(COUNTA(C2:F2)=0, "",</span>: This displays an empty score if the service doesn't have any completed tests.
- <span class="code-class-custom">COUNTIF(C2:F2,"=OK")</span>: This counts the number of tests that have passed (i.e. have a result of <span class="code-class-custom">OK</span>).
- <span class="code-class-custom">COUNTIF(C2:F2,"<>N/A")</span>: This counts the total number of applicable tests (i.e. tests that are not marked <span class="code-class-custom">N/A</span>).
The score is based on the number of passed tests divided by the number of failed tests. The result is an at-a-glance indicator of which services are verified to be reliable, and which ones need additional testing.
Congratulations, you've just tested the reliability of your services! This first spreadsheet is your baseline: it represents your starting point on your reliability journey. As you perform additional assessments, you can compare your new scores to your baseline scores to see just how much progress you've made, and hopefully show some improvements!
Step 4 - Perform additional assessments and track changes in reliability
Systems and services are changing constantly: new code gets integrated, infrastructure gets provisioned, and one-off changes or hotfixes get deployed. Any change like this can impact reliability, so you must repeatedly test your services to see if their reliability has decreased. Repeat testing also tracks improvements to reliability. If you make a change that makes a service more reliable, you won't know for sure until you test it again.
Before starting a new round of testing, duplicate the current page of your spreadsheet. Clear out the test results in the cells so that the new page is blank. This is your new results table for this next round of testing.
Make sure to add new services and remove services that are no longer relevant. Now repeat step 3 to fill in the new table with your new (hopefully improved) results.
Conclusion
Congratulations, you now have a living record of your reliability work and improvements! You can keep working off this spreadsheet you've created, or you can download our pre-made Reliability Tracker spreadsheet and modify it to fit your needs.
If you'd like a more automated and scalable way of tracking reliability, give Gremlin a try. Gremlin tracks all of your services and their dependencies, provides pre-built reliability tests that you can run with one click, and tracks your full testing history. You can easily see each service's reliability posture in the form of a reliability score. You can also track service reliability over time to quickly identify services that may have reliability risks, or recognize services that have become more reliable. Start with a free 30-day trial and see how easy it is to measure and manage reliability.
Avoid downtime. Use Gremlin to turn failure into resilience.
Gremlin empowers you to proactively root out failure before it causes downtime. See how you can harness chaos to build resilient systems by requesting a demo of Gremlin.GET STARTED
.svg)