How to validate your Kubernetes liveness probes using Gremlin


.svg)
.svg)

Introduction
In this tutorial, we'll show you how to create and validate a liveness probe for a Kubernetes application. We'll walk through deploying the Gremlin Kubernetes agent, deploying an application with a liveness probe, run a Latency attack, then validate that the probe triggers.
By reading this tutorial, you'll learn how to create a liveness probe and validate that it works as expected.
Overview
This tutorial will show you how to:
- Step 1 - Deploy a multi-node Kubernetes cluster
- Step 2 - Deploy the Gremlin Kubernetes agent
- Step 3 - Deploy an application with a liveness probe configured
- Step 4 - Run a Latency experiment to validate your liveness probe configuration
Background
In Kubernetes, a probe is an automated process that checks the state of a container at different stages in its lifecycle, or at regular intervals. Kubernetes includes three types of probes: liveness probes, startup probes, and readiness probes.
- Liveness probes are essentially health checks. They periodically run a command (or send an HTTP request to an endpoint) on a container and wait for a response. If a response doesn't arrive, or the container returns a failure, or fails to respond within a certain time frame, the probe triggers a restart of the container.
- Startup probes are used alongside liveness probes to protect slow-starting containers. If you have a container that takes a long time to start—longer than your liveness probe threshold—you can use a startup probe to delay the liveness probe until the container has fully started.
- Readiness probes are also alongside liveness probes for containers that have finished starting, but aren't yet ready to serve traffic. This is for containers that do some kind of initialization task, like loading data from a remote data store or waiting for a downstream dependency to become available. Readiness probes can detect this and prevent liveness probes from restarting the container, while also preventing requests from reaching the container.
For more on the different types of probes, see the Kubernetes docs. The Google Cloud team also has a great blog post on Kubernetes probes and best practices.
Prerequisites
Before starting this tutorial, you’ll need the following:
Step 1 - Deploy a multi-node Kubernetes cluster
For this tutorial, you'll need a Kubernetes cluster with at least two worker nodes. If you already have a cluster, you can continue to step 2. If not, you can create your own cluster using a tool like K3s, minikube, or kubeadm, or use a cloud Kubernetes platform like Amazon EKS, Azure Kubernetes Service, or Google Kubernetes Engine.
Once your cluster is deployed, verify that you have at least two active worker nodes by opening a terminal and running the following command :
In this example, we have one control plane node and two workers:
Step 2 - Deploy the Gremlin Kubernetes agent
The Gremlin Kubernetes agent is the recommended method of deploying Gremlin to a Kubernetes cluster. It allows Gremlin to detect resources such as Pods, Deployments, and DaemonSets, and select them as targets for running experiments. If you've already installed and configured the agent, skip to step 3.
To install the agent, follow the installation instructions in the documentation. Make sure to replace <span class="code-class-custom">$GREMLIN_TEAM_ID</span> with your actual team ID, <span class="code-class-custom">$GREMLIN_TEAM_SECRET</span> with your team secret key, and <span class="code-class-custom">$GREMLIN_CLUSTER_ID</span> with a unique name for this cluster. You'll use the cluster ID to identify the cluster in the Gremlin web app. You can learn more about team IDs and secret keys in the Authentication documentation.
Once the agent is installed, you can confirm that it's configured correctly by logging into your Gremlin account, opening the Agents page, then clicking the Kubernetes tab. Your cluster will be listed with the name provided by <span class="code-class-custom">$GREMLIN_CLUSTER_ID</span> :

Step 3 - Deploy an application with a liveness probe configured
Now we'll deploy an application and create a liveness probe. For this tutorial, we'll use the open source Online Boutique application created by the Google Cloud Platform team. Online Boutique is a demo e-commerce website consisting of 12 services, each one running in a separate Deployment. Several of these Deployments already have liveness probes configured. The one we'll focus on for this tutorial is the frontend, which has both a liveness and readiness probe.
If we look at the application's Kubernetes manifest, we see that there's a liveness probe configured to run an HTTP request over port <span class="code-class-custom">8080</span> on the container's <span class="code-class-custom">/_healthz</span> endpoint. Kubernetes will wait 10 seconds before running the first check according to the line <span class="code-class-custom">initialDelaySeconds: 10</span> , and since <span class="code-class-custom">periodSeconds</span> isn't defined, Kubernetes uses the default value of 10 seconds. By default, the probe will also time out after 1 second (<span class="code-class-custom">timeoutSeconds: 1</span>), will retry three times before reporting a failure (<span class="code-class-custom">failureThreshold: 3</span>), and will report a success for each successful check (<span class="code-class-custom">successThreshold: 1</span>). According to line 238, it will also include a cookie in the HTTP headers identifying the request as coming from the liveness probe.
To summarize: the frontend Pod defines a liveness probe that will send a request to the Pod's <span class="code-class-custom">/_healthz</span> URL on port <span class="code-class-custom">8080</span> every 10 seconds. It will wait 10 seconds before running the first check, and will require three consecutive failed checks before reporting a failure.
The frontend also has a readiness probe that follows the same behavior. The only difference is that this probe's HTTP cookie is set to <span class="code-class-custom">shop_session-id=x-readiness-probe</span> instead of <span class="code-class-custom">shop_session-id=x-liveness-probe</span>.
To deploy the Online Boutique, either follow the quick start guide or simply run the following command:
You can check on the status of the deployment by running:
We can check the status of our liveness probe by running <span class="code-class-custom">kubectl describe</span> on the frontend Deployment and looking for the <span class="code-class-custom">Liveness</span> field. Note that the <span class="code-class-custom">success</span> and <span class="code-class-custom">failure</span> parameters are commented out, meaning they're using their default values of 1 and 3 respectively:
Step 4 - Run a Latency experiment to validate your liveness probe configuration
The last step is to ensure that our liveness probe works the way we expect it to. In step 3, we found that our liveness probe is configured to run every 10 seconds, will fail after 3 unsuccessful checks, and considers a check unsuccessful if it takes longer than 1 second for the endpoint to respond. To test it, we'll use a Latency attack to delay all network traffic from the Pod. We'll add enough latency to exceed the timeout period for at least 30 seconds to ensure at least three failed checks in a row.
First, log into the Gremlin web app and create a new attack by navigating to Attacks, then New Attack. Select the Infrastructure tab, then select Kubernetes. Expand Deployments, then select the frontend Deployment.
Next, click on Choose a Gremlin to expand the attack selection box, select the Network category, then select Latency. Increase MS to <span class="code-class-custom">1000</span> to add one full second of latency, then click Unleash Gremlin to start the attack.
While the attack is running, use <span class="code-class-custom">kubectl</span> (or a monitoring tool) to monitor the state of your frontend Deployment. You can check the current health of the frontend Deployment by running the following command:
Shortly after the attack starts, we see the following:
We also see an interesting development in the Gremlin web app. Instead of showing the attack stage as "Successful", it instead shows "Agent Aborted".
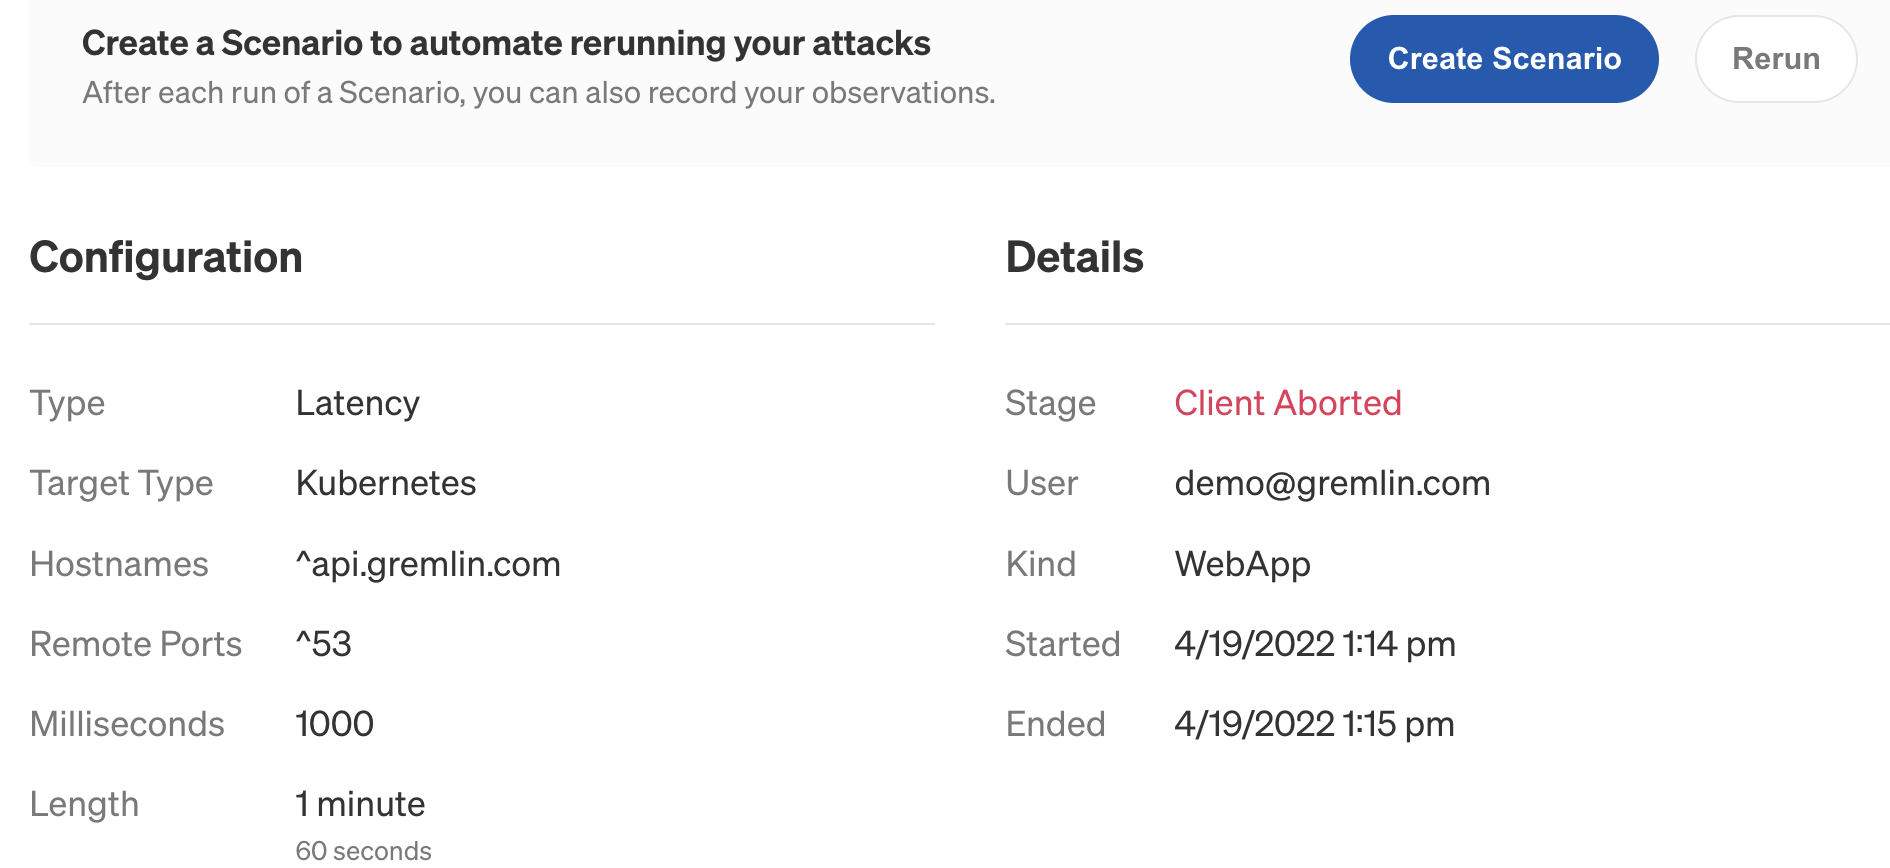
If we scroll down to the Executions section and click on our host, we see this in the execution log:
In other words, the liveness probe worked as intended and terminated the frontend Pod when it took too long to respond. Because the Gremlin container running the latency attack no longer had a valid attack target, it also terminated. This is why the web app reports "Agent Aborted." If we look back at our kubectl output a few moments later, we'll see that the Pod has restarted and the Deployment is healthy again:
This shows that our liveness probe is working reliably and keeping our application available and responsive.
Conclusion
In this tutorial, we used Gremlin to validate that our liveness probe will keep our frontend Deployment running reliably. There are additional steps we can take to improve reliability even further, such as scaling up our Deployment to two or more Pods to avoid the small amount of downtime that happened when the probe terminated the old Pod.
For more ideas on experiments to run on your Kubernetes cluster, check out our white paper on the first 5 Chaos Experiments to run on Kubernetes.
Related

Avoid downtime. Use Gremlin to turn failure into resilience.
Gremlin empowers you to proactively root out failure before it causes downtime. See how you can harness chaos to build resilient systems by requesting a demo of Gremlin.GET STARTED
.svg)